The NIPI is a measure of inflation trends through news articles. Our Language Models scan through a gigantic amount of news sources in multiple languages and the NIPI measures the balance between positive and negative news on a daily basis.
During COVID, the indicator caught the inflation surge in a timely way, often well ahead of consensus, thanks to its ability to track unusual shocks, such as food items shortages.
How does it behave now that inflation pressures are on an easing trend?
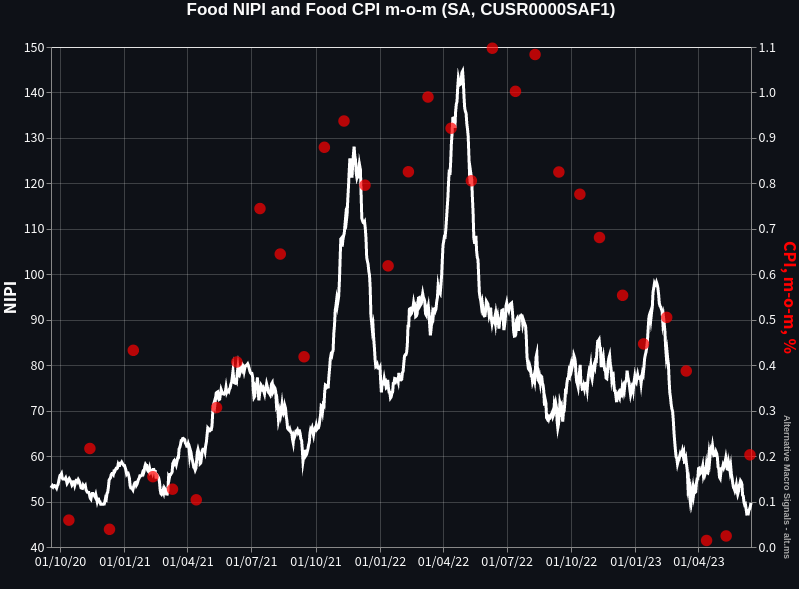
The below chart shows US CPI Food inflation (month-on-month, Seasonally Adjusted - the red dots) and our Food NIPI (50 level=neutral - the white line). To avoid look-ahead bias, both series are shown as of release date.


Note: a NIPI value of 50 is indicative of a balanced volume of positive and negative inflation news, a value above (below) 50 indicates positive (negative) inflationary pressures in the near-term.
Focusing on the most recent period, the US Food NIPI peaked early May 2022, which was about 3 months ahead of the CPI. Early 2023, it indicated some re-acceleration (Egg price upsurge, mostly), then some further deceleration, thereafter confirmed by the CPI releases, including the May CPI.
Language models have their place in the toolbox to monitor macroeconomic developments. The solutions we have developed at AMS rely implement Supervised Learning, transfering some of the expert knowledge to last-generation language models.
Read more:
- NIPI Data Overview
- How Does Our NIPI Track Official Inflation: US Headline CPI, Sept. 2022 Release, 13 Oct. 2022
- Why Inflation Forecasting is So Hard? The Role of Idiosyncratic Shocks, 13 Jul. 2022
- Tracking narratives to forecast food prices, 13 Oct. 2021
