The News Inflationary Pressures Indices (NIPI) are our diffusion indices summarizing inflation news. In this analysis, we test whether they formally lead households inflation expectations in the US, Euro area, and UK. The results provide strong evidence that the NIPI can be considered a leading indicator for inflation expectations, with significant predictive power across multiple regions.
Following our previous analysis investigating the News Inflationary Pressures Indices (NIPI) as a leading indicator for official CPI releases, we check whether the NIPIs predict changes in inflation expectations.
Inflation expectations are crucial for monetary policy and financial markets, as they influence wage negotiations, price-setting behavior, and ultimately inflation itself. As such, they can help time important changes in the monetary policy stance. If our language models can detect signals that lead changes in inflation expectations, this would provide additional evidence of their ability to provide important near-term inflation and interest rates signals.
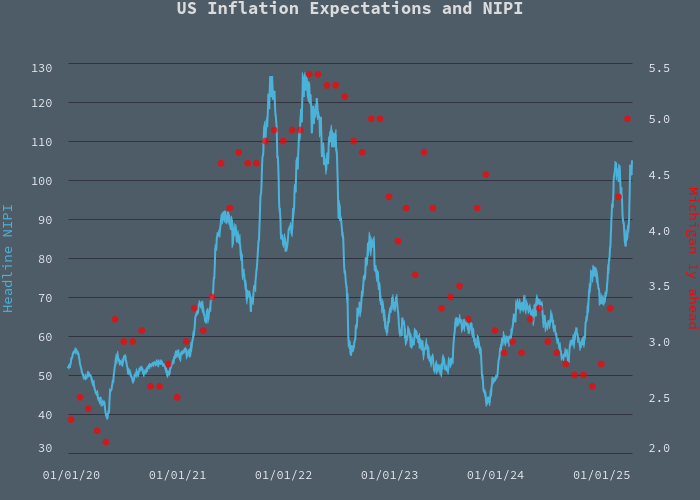
The most recent US data does suggest some degree of correlation between NIPI and inflation expectations surveys. Given those surveys frequency is at best monthly, there would room for the daily NIPI to lead inflation expectations releases.
With our growing dataset now spanning over seven years, we can apply formal time-series analysis. This note presents the results of Granger causality analysis, which are the standard test to determine lead-lag relationships between two time series. We will refer the reader to the earlier CPI lead note for a comprehensive methodology and implementation discussion.
As a preview of our findings: the evidence strongly suggests that the NIPI does indeed lead inflation expectations across the US, Euro area, and UK, with negligible evidence of reverse causality. This reinforces the value of our natural language processing approach in capturing early signals of changing inflation trends.
Data under review
For this analysis, we examine the relationship between our NIPI indices and widely-followed measures of inflation expectations.
In the United States, we use the University of Michigan's Consumer Sentiment survey data on expected inflation rates for the next year, one of the most established measures of US consumer inflation expectations.
For the Euro area, we utilize the European Commission's DG ECFIN Consumer Confidence survey, specifically the balance of responses regarding price trends over the next 12 months.
For the United Kingdom, we incorporate the YouGov/Citi Inflation Tracker, which measures the median expected development of consumer prices over the next 12 months.
The below table describes the data. Shift (days) represent the number of days the data has been shifted from the first day of the month to account for publication lags. We utilize here pseudo real-time data: the proxy rule closely approximates real release times, typically deviating from actual dates by only a few days.
| Region | Name | Macrobond code | Shift (days) |
|---|---|---|---|
| US | University of Michigan, expected change in inflation rates, next year | ussurv0357 | 12 |
| Euro area | DG ECFIN, Consumer Confidence, Price Trends Over Next 12 Months, Balance | cons2_ea_tot_6_bs_m | 30 |
| UK | YouGov/Citi, Expected Inflation in the Next 12 Months, Median | gbsurv0489 | 50 |
On the NIPI side, we test two variants for each region:
- The core NIPI, which excludes food and energy inflation news
- The Headline NIPI
The study covers the sample period from 1st January 2018 (the start of the NIPI series) until 31st December 2024.
Granger-causality framework and implementation
As in our previous analysis, we employ Granger causality tests to determine whether one time series leads another. The framework examines whether past values of variable x enhance the forecasting accuracy of variable y.
Our implementation follows the same three-step process:
1. Stationarity analysis
We first test all time series for stationarity using the Augmented Dickey-Fuller (ADF) test. For the UK inflation expectations series, we found it necessary to use first differences to achieve stationarity (in this case, deviation from 36-months trend), while other series were stationary in levels.
2. VAR Optimal lag choice
We determine the optimal lag structure using both Bayesian Information Criteria (BIC) and Akaike Information Criteria (AIC). The results generally suggest optimal lags of 1-3 months, though some series (e.g. in the Euro area) show occasional evidence of longer lag structures.
3. Hypothesis Testing
Finally, we conduct the Granger causality tests to evaluate whether NIPI leads inflation expectations and vice versa. We test both directions of causality to provide a comprehensive assessment of the relationship.
The threshold for statistical significance is set at 0.1 (10%).
Results
| Lags (months) | |||||||||
|---|---|---|---|---|---|---|---|---|---|
| Region/NIPI | 1 | 2 | 3 | 4 | 5 | 6 | 7 | 8 | 9 |
| US | |||||||||
| Headline | |||||||||
| Core | |||||||||
| Euro area | |||||||||
| Headline | |||||||||
| Core | |||||||||
| UK | |||||||||
| Headline | |||||||||
| Core | |||||||||
| Note: a green cell denotes Granger causality from NIPI to inflation expectations, for the given lag consistent with both AIC and BIC. A light green cell denotes Granger causality from NIPI to inflation expectations, for the given lag consistent with either AIC or BIC. Test threshold set at 10%. |
|||||||||
The results in Table 2 suggests the NIPIs lead inflation expectations:
- In the US, both NIPI variants (Core and Headline) strongly lead inflation expectations at lags of 1-3 months
- In the Euro area, the Headline NIPI shows particularly strong leading properties, with significant causality detected at lags of up to 7 months
- In the UK, both NIPI variants lead inflation expectations, though primarily at shorter lags (1-2 months)
These findings suggest that news about inflation captured by our language models contains information that predicts future changes in public inflation expectations. The effect is particularly strong in the short term (1-3 months), but in some cases extends to medium-term horizons.
But what about the reverse relationship? Do inflation expectations also lead the NIPI? Table 2 examines this direction of causality:
| Lags (months) | |||||||||
|---|---|---|---|---|---|---|---|---|---|
| Region/NIPI | 1 | 2 | 3 | 4 | 5 | 6 | 7 | 8 | 9 |
| US | |||||||||
| Headline | |||||||||
| Core | |||||||||
| Euro area | |||||||||
| Headline | |||||||||
| Core | |||||||||
| UK | |||||||||
| Headline | |||||||||
| Core | |||||||||
| Note: a green cell denotes Granger causality from inflation expectations to NIPI, for the given lag consistent with both AIC and BIC. A light green cell denotes Granger causality from inflation expectations to NIPI, for the given lag consistent with either AIC or BIC. Test threshold set at 10%. |
|||||||||
Interestingly, there is very little evidence that inflation expectations lead the NIPI:
- In the US and UK, we find no significant Granger causality from inflation expectations to either NIPI variant at any lag
- In the Euro area, there is some relatively weak evidence of causality from expectations to the Headline NIPI, but only at longer lags (6-7 months). The fact that the relationship exists only at very long horizon would suggest that both series, NIPI and expectations, react to the same determinants in the long term, unsurprisingly, rather than suggesting proper lead from one to the other.
This asymmetry in the lead-lag relationship is particularly noteworthy. It suggests that the NIPI captures information about future inflation sentiment that is not already reflected in current expectations. This reinforces the value of our natural language processing approach in providing forward-looking signals.
Summing-up our main findings:
- The NIPI leads inflation expectations across all three major economies (US, Euro area, UK)
- The lead is strongest in the short term (1-3 months)
- There is minimal evidence of reverse causality, suggesting the NIPI captures novel information
- Both core and Headline NIPI variants show leading properties, with Headline possibly leading further out in the Euro area
- The results echo earlier findings between the NIPIs and CPI releases
As our datasets continue to grow, we expect to further refine these analyses and explore additional relationships between news sentiment and economic variables. The consistent evidence of leading properties across different measures reinforces our confidence in the NIPI as a valuable tool for inflation monitoring.
Large Language Models have a clear role to play in macroeconomic forecasting, particularly when implemented in a targeted, supervised manner with domain expertise guiding the model development. The NIPI represents just one application of this approach, and we continue to explore new ways to leverage natural language processing to extract economic signals from unstructured data.
