|
|
|
18 Mar. 2022
Inflation forecast bias and how to remedy it with alternative text data
|
|
|
|
Month after month and across regions, inflation keeps exceeding consensus forecasts. It's not like inflation has not been a focus point lately... yet, the persistent bias is remarkable.
What does it reveal about inflation forecasting?
Let's dig into the forecasting process to identify a couple of key weak points:
|
|
|
|
1/ Linear time-series models limitations
Economic forecast models are linear. The real world is not necessarily.
The difference between a 10% commodity price shock and a 100% shock is not a factor 10. It's a lot more. With a 10% input shock, most firms will have some discretion as to pass on the increase to customers or not. With a 100% shock, many won't have a choice as their margin is completely eaten.
Most shocks are 10%-like. So a typical time series model would logically underestimate the impact of a much larger shock (in absolute terms, can be a large positive or negative shock, the reasoning is the same).
|
|
|
|
2/ Usual input data limitations
As fellow inflation forecasters are aware, to passively use time-series models is rarely a consensus-beating strategy.
That's not just because of the above model limitations, but also owing to a genuine lack of structured data to capture near-term inflation volatility. Indeed, inflation at a 3-month horizon is an aggregation of many, largely unrelated, individual price developments.
Macro-economic factors, a bit easier to apprehend consistently, kick in only at a much longer horizon, say 1 year and beyond.
The trouble is, most of the time, there are no good time series to monitor all these one-offs, unrelated shocks. Many would move significantly only once in a decade, at best. And there are hundreds of them to potentially keep an eye on.
So we cannot just count on structured data (time-series).
|
|
|
|
These observations brought us to developing the technology behind AMS, to the use of text web-scraping and Natural Language Processing in particular:
-
we have taught powerful language models to identify news relevant to the near-term inflation forecast, from hundreds of thousands of news sources,
-
we aggregate this information to turn it into quantified signals.
The goal is to enhance traditional time-series models, helping set forecast residuals and identify these unusual patterns and regime changes that do not fit in traditional data.
Turns out the last two years or so have provided some remarkable case study.
|
|
|
|
Looking back at recent US CPI and EA HICP developments
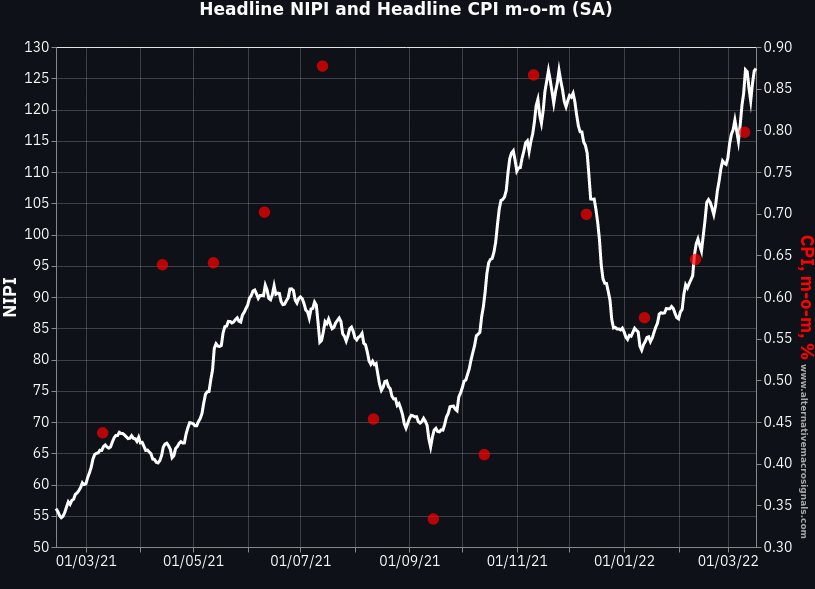
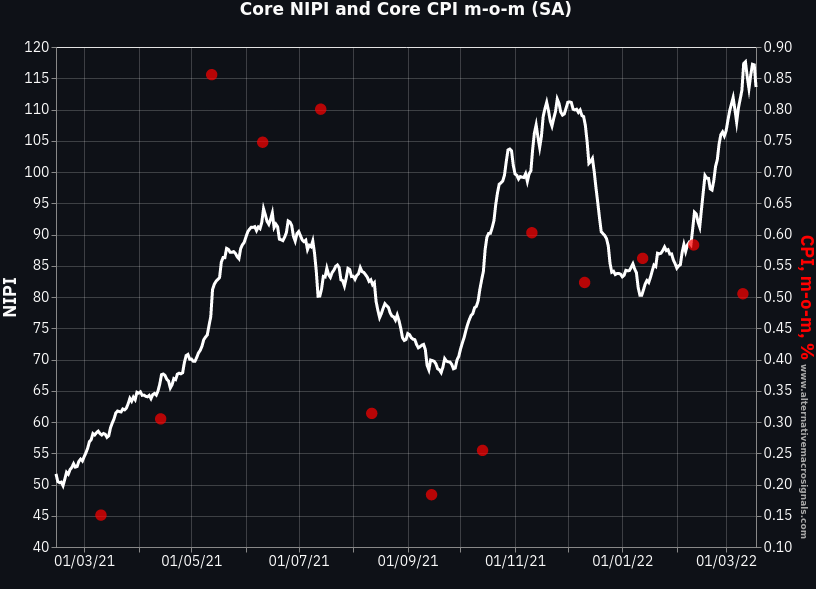
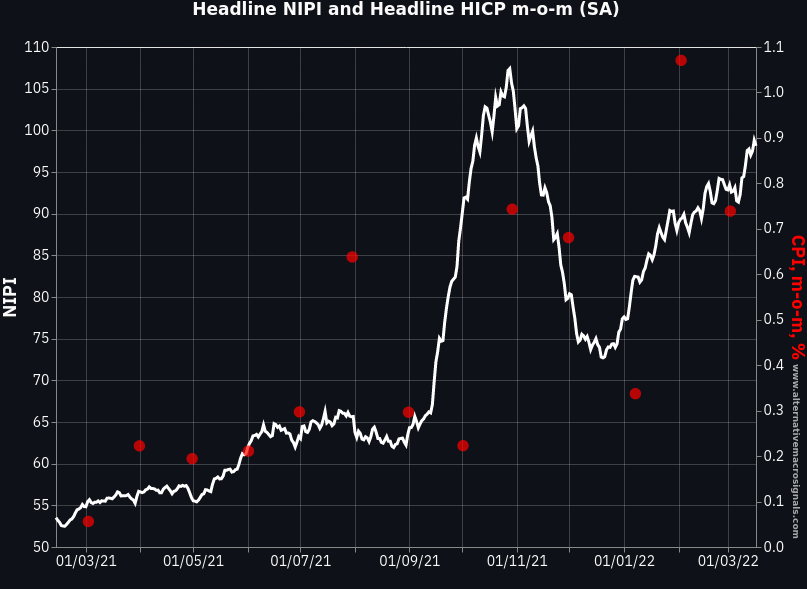
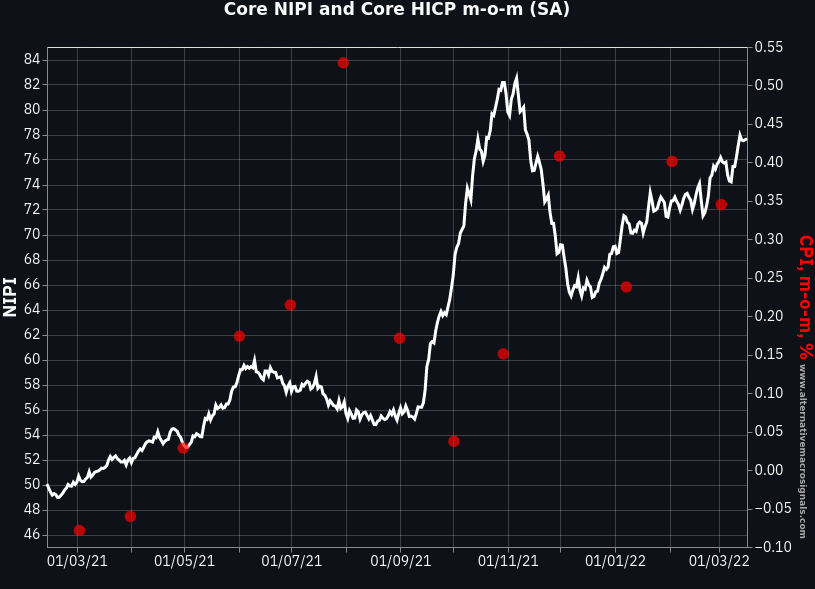
We show below our NIPI (News Inflation Pressures Indices), diffusion indices with 50 implying balanced price pressures. These are available daily, pretty much in real-time (just a few hours after the end of day). They are the white lines on the below charts.
We compare our NIPI with the month-on-month rates of inflation, as of release date to avoid the look-ahead bias (the red dots). The inflation rates are seasonally adjusted by the statistical source (US BLS and ECB).
|
|
|
|
|
|
Our data has overall been consistent with the high-inflation regime. In addition, the NIPI caught pretty much all turning points in a timely fashion.
The lead is somewhere between a few weeks and a couple of months, as should be expected.
Sometimes, a discrepancy arises and brings an interesting question. The last observation in US Core CPI was still strong but potentially lower than the NIPI would have suggested. The reason is that a large part of the Core NIPI rise is attributable to rent inflation stories (as can be seen in the NewsBot), which will only feed through the CPI item with a longer lag than most other CPI components.
In any case, unstructured data (text-derived) should find its way in the inflation forecasting process, alongside more traditional methods.
|
|
|
|
Our inflation products
-
the NewsBot - a timely selection of news relevant to the near-term inflation forecast (and another one specifically for wages news). The news are summarized and translated in English.
-
the NIPI database, quantitative signals derived from these news using our prop NLP models.
|
|
|
|
NewsBot Coverage
Location
All regions in the world, as long as the news are in one of the six languages we currently cover:
Chinese, English, French, German, Italian and Spanish
News sources
Online version of newspapers, reviews, specialized publications.. hundreds of thousands of those, literally.. from the county newspaper to the professional review.
Frequency
Daily or intra-day
|
|
|
|
NIPI Coverage
Regions
DM: US, UK, Euro area (France, Germany, Italy and Spain), Canada, Australia
EM: China, India, South Africa, Mexico and Argentina
Frequency
Daily
History
1/1/2018 to yesterday
(backdating to 2014 in progress)
|
|
|
|
|
|
Earlier posts
-
Newsletter: China NIPI First release! 09/02/2022. Available here.
-
Newsletter: EM Inflation, US CPI Look-back, NIPI App Feature Update, 21/12/2021. Available here.
-
Newsletter: No Base Effects Here, NIPI bounded, 1/12/2021. Available here.
-
Blog Post: "The NIPI as a predictor of US inflation: Nov-2021 update", 10/11/2021. Available here.
-
Newsletter: 700+ / day, Chinese news. 10/11/2021. Available here.
-
Blog Post: "Tracking narratives to forecast food prices", 13/10/2021. Available here.
|
|
|
|
|
|
|
|
|
