Blog
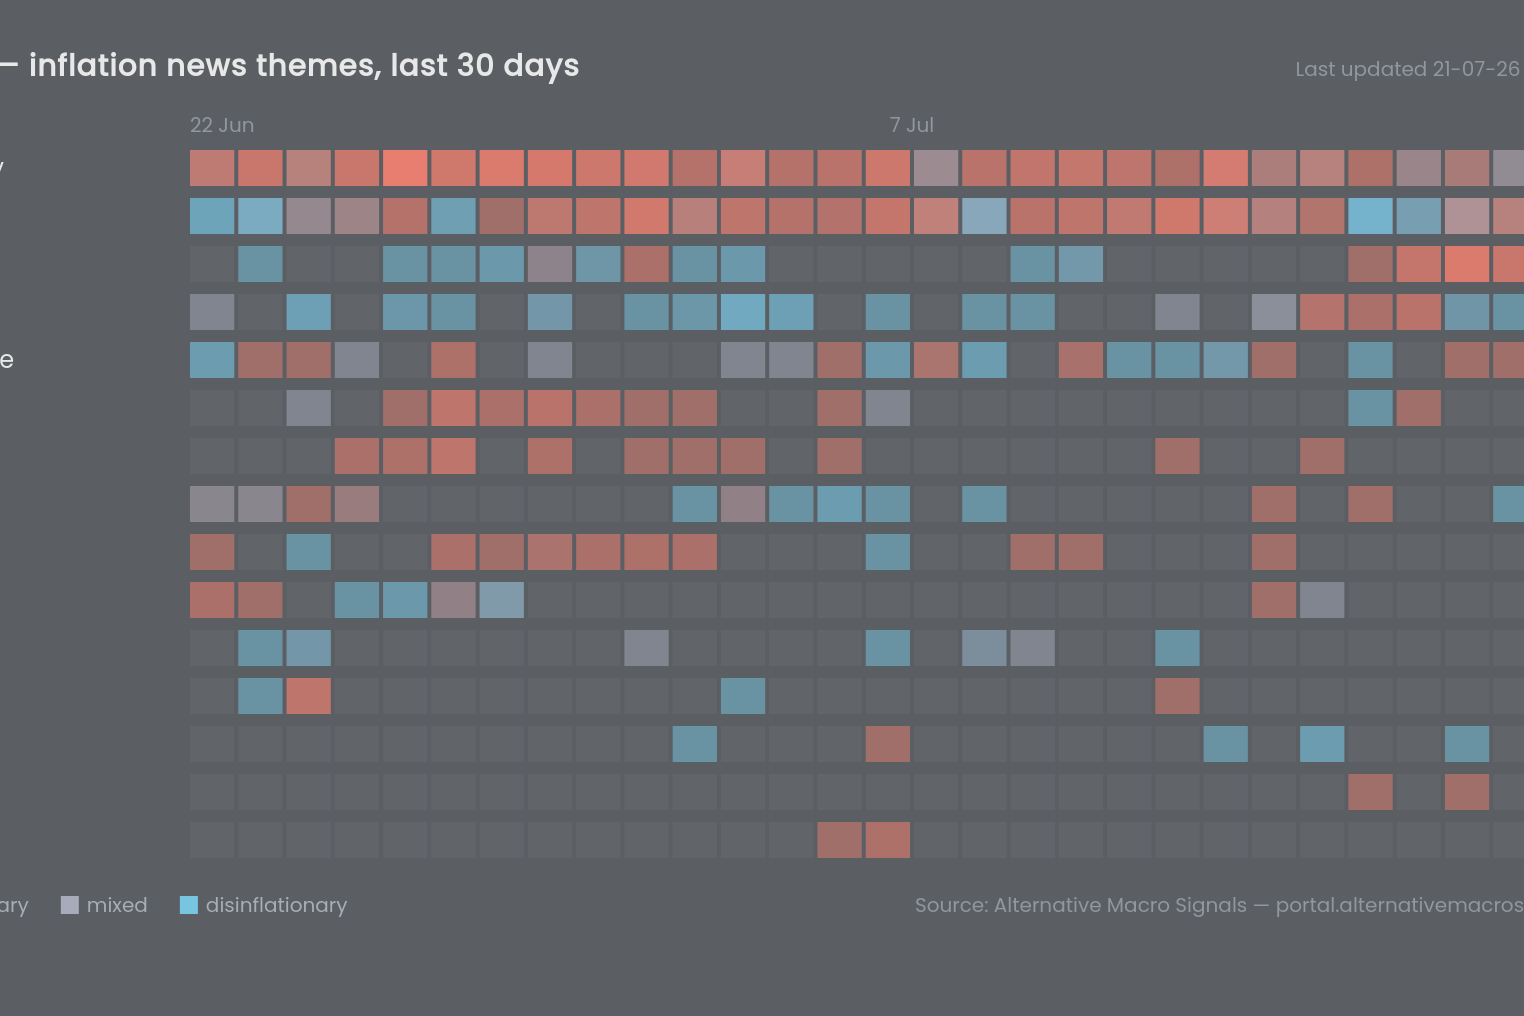
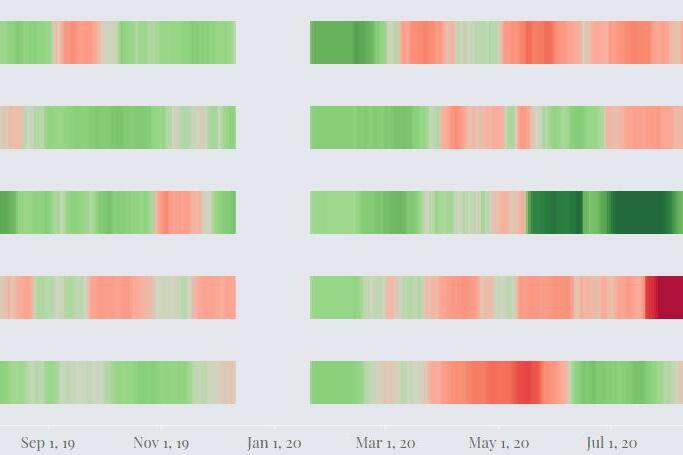
Themes Heatmaps: Inflation Narratives at a Glance
A new tool to identify which topics are driving inflation across ten economies, in which direction, and how that has shifted over the past month.

Tweaking the NIPI parameters to improve inflation forecast accuracy
A grid search across six countries shows which NIPI parameters matter and which do not.
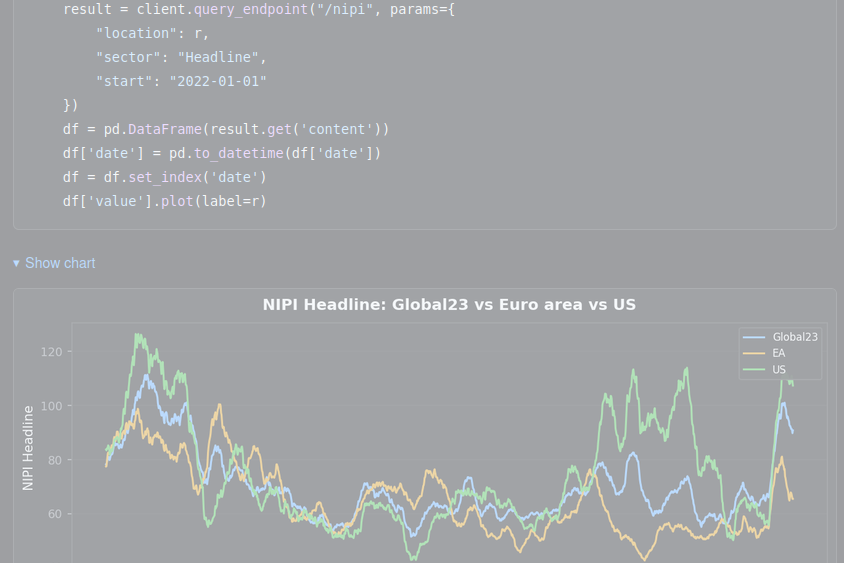
Working with the API: NIPI and Entropy Use Cases
A guide to the /nipi API endpoint with practical examples for querying NIPI data and its underlying Entropy components.
Can the NIPI Forecast Inflation in Europe? A Cross-Country Out-of-Sample Test
We evaluate whether the NIPIs can forecast near-term inflation in Europe.

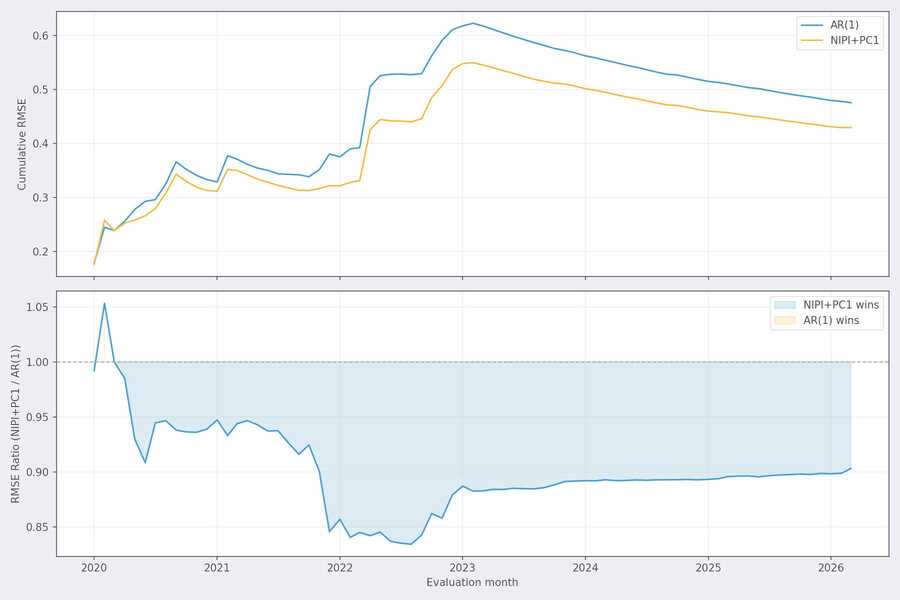
Forecasting Global Inflation Using the Global23 NIPI Aggregate
We confront the Global23 NIPI aggregate with tough benchmarks: the OECD Economic Outlook and a standard ARMA(1,1) model.
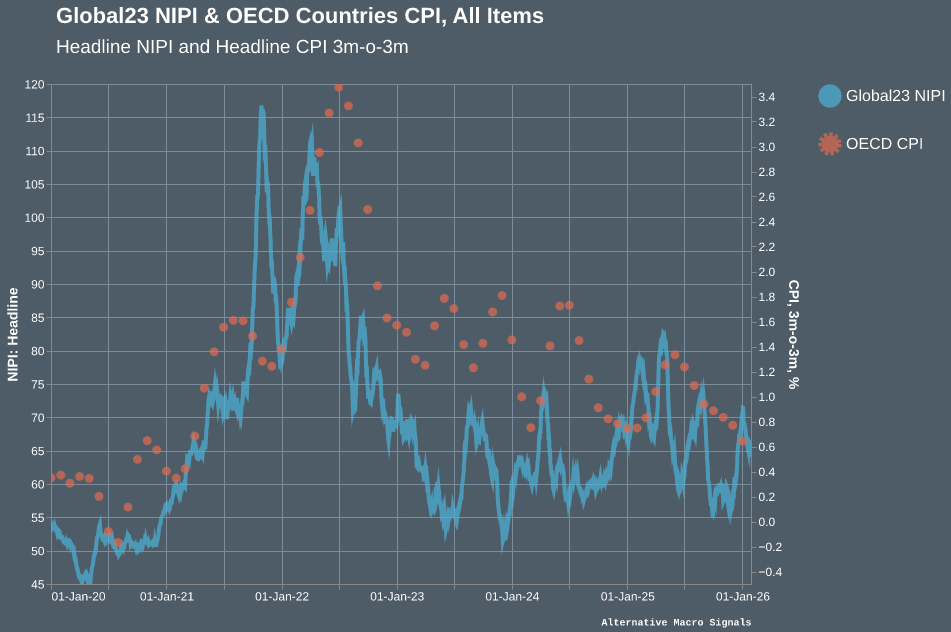
Monitoring Global Inflation Using the Global23 NIPI Aggregate
Short-term global inflation trends can be proxied by the Global23 NIPI aggregate.
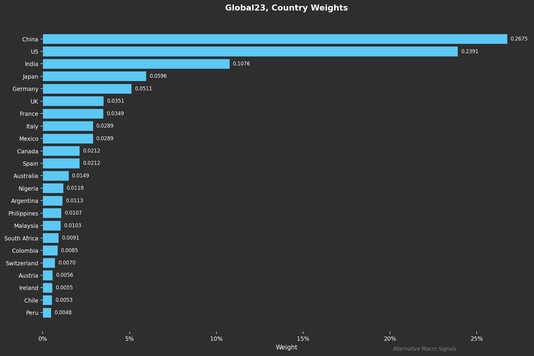
Global23 NIPI Aggregate Methodological Note
How Global23 NIPI is constructed: methodology behind the GDP-weighted news-based inflation index tracking global headline CPI pressures.

Tracking US Electricity Price News
US electricity prices have surged since 2025, driven by AI demand and an aging grid. We show how to track electricity news in real-time.

How can we track supply chain inflation in the tariff era?
Introducing the Supply Chain Inflation metric, derived from the News Volumes in the NewsBot app.

NIPI as a leading indicator for inflation expectations: new statistical evidence
We find strong evidence that the NIPI can be considered a leading indicator for inflation expectations, with significant predictive power across multiple regions.
Newsletter. Global NIPI Release And Inflation Stress Update
Check out our new global inflation daily diffusion index and the latest on the US inflation perception rebound.

Expanding Our Daily Inflation Databases: 8 New Countries Added to the NIPI
23 countries are now covered in our daily inflation data.
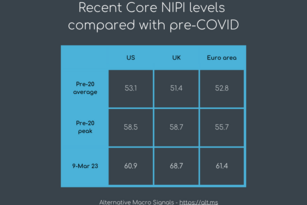
The NIPI as an inflation leading indicator: what statistical evidence?
Putting the NIPI through the test, we find evidence it can have up to 3 months lead over official inflation releases in the US and Euro area.
Newsletter. Post-COVID macro: uncertainty and volatility. Can alternative inflation data help?
Inflation may have peaked, but it is far from having normalized. A case for sticking with alternative data... and an open-mind.

Investigating The Post-COVID Inflation Dynamics - Part I: Great Volatility?
The data shows euro area inflation volatility remains puzzingly elevated at this point, when compared with the US.
Newsletter: Hidden Gems From Our Language Models Database
The lesser-known data in our datasets, but also: the latest on NIPI vs CPI and HICP and NewsBot App feature update.

Not Just One Way to Look At It: Metrics From Our Inflation Datasets
Four different ways to track and analyze inflation turning points, using the quantified signals from our datasets and powerful language models.

Three Years After: How Does the NIPI Track The Eurozone Inflation Trend?
A look at our news-based inflation diffusion index in the euro area which has still some way to go to normalize.
Newsletter - Unleashing Language Models for Economic Insights
Language Models call for a mental shift, from trying to replicate existing data to creating new data we have never had access to before.

Can Language Models Tackle Data Blind Spots? Introducing the "News Balance", Bespoke Inflation Series
Introducing our new inflation metrics. Not just a new model or dataset, but a whole new way of leveraging Language Models. "

Comparing Car Price Dynamics in the US, China, the Euro area and Japan in 2023, using the News Balance
Car price dynamics have diverged in the economies in 2023. We illustrate how the News Balance can provide real-time international insights into sector-level inflation dynamics. "
Newsletter - Past The Peak: ChatGPT Hype And Headline Inflation
What does ChatGPT change to the way we operate? And a look at Inflation Normalization progress.

Language Models Can Track Track Food Prices In an Easing Phase Too
Language Models trained to identify inflation relevant news continue to lead US food price inflation.
Newsletter: Is This "Normal"?
Inflation normalisation, Japan exception and Car price crash in China.
Could Japan Inflation Dynamics Be Spiraling Out of Control?
Uniquely among G7 economies, the NIPI suggests underlying inflation is not about to slow down any time soon in Japan, as core and wages pressures continue to build up.

Newsletter: The Inflation NewsBot Just Learnt Two New Languages!
Swedish and Polish news articles are now included in the Inflation and Wages NewsBots.
Newsletter: What do ChatGPT and Natural Language Processing Mean For Research and Investment?
The innovation behind ChatGPT - the Transformers Language Models - are even more relevant than the specific chatbox application, because any text can be quantified now.
Newsletter: Inflation Volatility Regime Change And Alternative Data
Today's language models are proving surprisingly reactive to the new environment. They help overcome the limitations of traditional data and models when volatility is on the rise.
How Does Our NIPI Track Official Inflation: US Headline CPI, Sept. 2022 Release
Our inflation diffusion index based on news articles filtered by our NLP models has continued to track remarkably well headline inflation in the US.

We Have Enhanced Our Inflation Datasets and Models to Incorporate News in Japanese!
Japanese news articles are now fully integrated in our suite of inflation monitoring data.

Can the NIPI Identify Inflation Downturns as Well as It Has Signalled Upturns?
The NIPI has been signalling near-term inflation turning points, including the deceleration in US CPI Inflation at the start of the summer 2022.

Loud and Clear: Combine Our NIPI (Direction) And NVI (Volume) To Spot Inflation Turning Points
We show how to combine the information from two of our timely inflation indicators to detect near-term turning points.

Why Inflation Forecasting is So Hard? The Role of Idiosyncratic Shocks
In the short term, inflation is a collection of largely unrelated micro shocks. Natural Language Processing can help process the huge amount of information required.

Energy Price Forecast: So Much More Than Oil Price
Energy prices dynamics can now substantially diverge from one region to the other. AMS NIPI Energy prices helps keep track of retil energy price developments in real time.
Subdued China Inflation? Our fresh Chinese NIPI indicators provide new insights
China is far from immune to the global inflation shock

First release of the China News Inflation Pressures Indices (NIPI)
We have compiled hundreds of thousands of news articles in Chinese to build the first ever NIPI for China.
Beyond base effects: Eurozone NIPIs and HICP inflation momentum
To monitor inflation momentum is tricky when seasonal adjustment is an issue. Enter the NIPIs.
The NIPI as a predictor of US inflation: Nov-2021 update
Timely catch of recent US CPI inflation turning points
Tracking narratives to forecast food prices
Our NIPI has down a fine job tracking US food prices when compared to traditional data
Is Euro Area Inflation at a Breakpoint?
Our new euro-area NIPI shows a marked increase in inflation pressures, within just a few weeks

Longer-lasting "transitory"...
The overriding consensus remains that the inflation shock is transitory: is it justified or is it a failure to conceive something else than "back to previous state" post-COVID?
Global inflation update: broader shock
Our News Inflation Pressure Indices now clearly signal a broadening of the shock, to Europe in particular
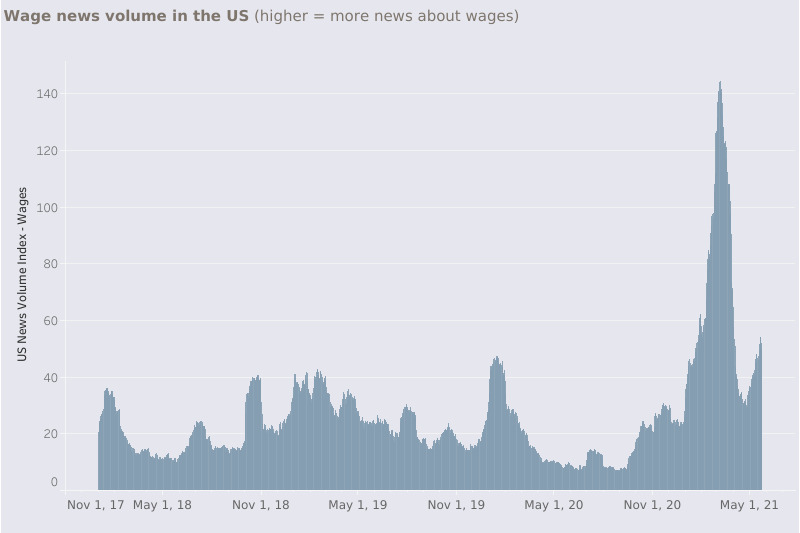
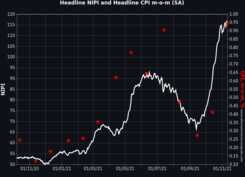
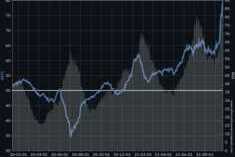
In the news: a marked acceleration in US wage inflation
Our news tracking models have signaled a significant acceleration in US wages, since the start of 2021

User guide: programmatic access to the NIPI database and the Inflation NewsBot
Easy Python scripts to access our data

News Inflation Pressure Indices vs US CPI
A quick look back at how our NIPI signaled US CPI turning points in the last 18 months.

The global food price upsurge: a quick look-back at our indicators
Food prices jumped at the end of last year. Check what our News Inflation pressure Index had to say back then.
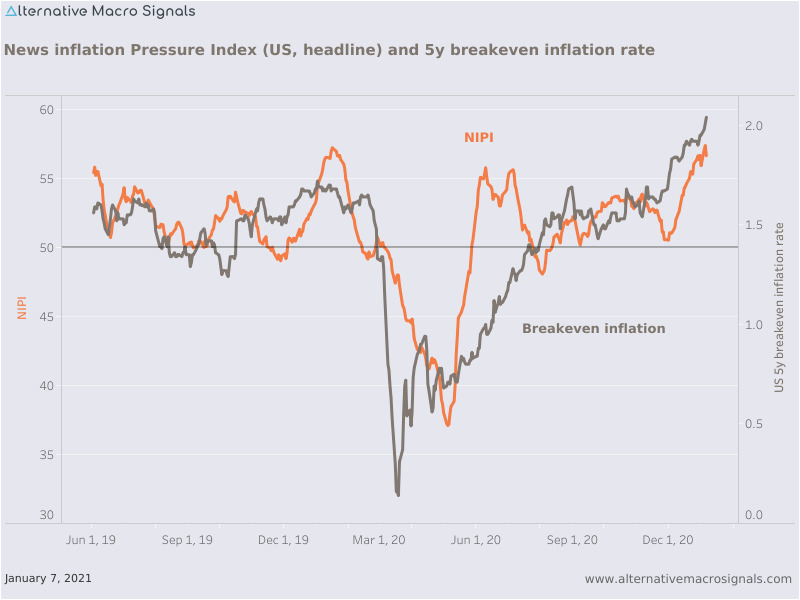
NIPI Market Signal
Comparing the News Inflation Pressure Index and Breakeven Inflation rates
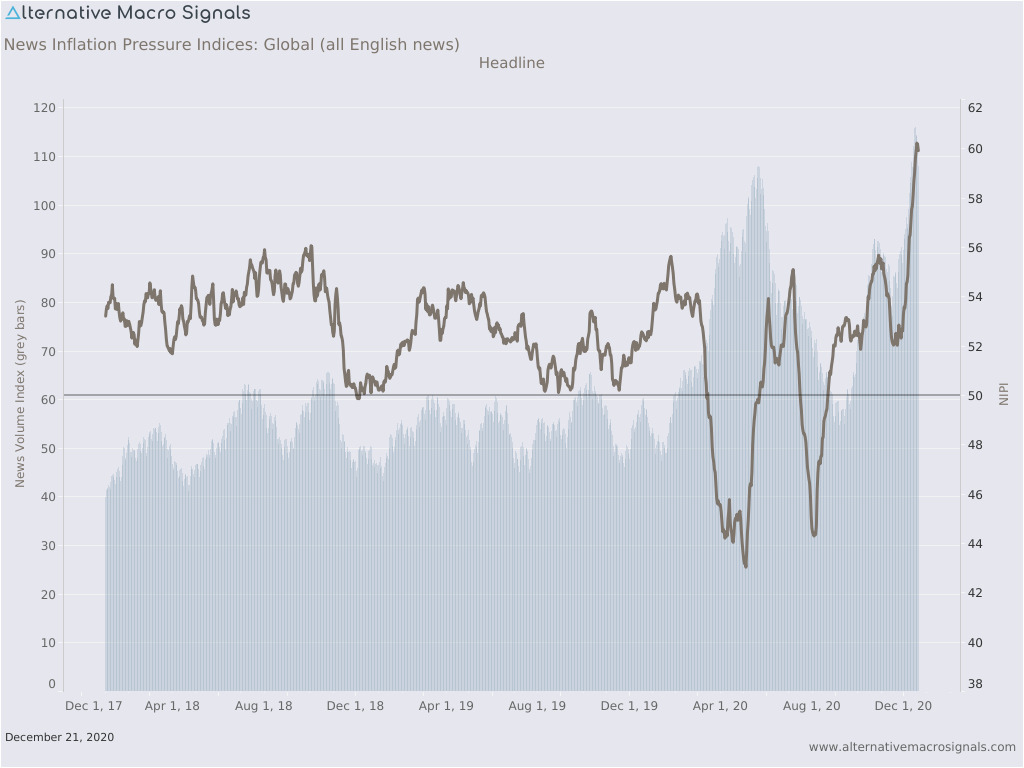
Global headline inflation upsurge
Our NIPI is at a 3y high (21-Dec-2020)

Whose sentiment?
One or two annoying things about sentiment indicators in macro
Too often, a "sentiment" indicator is there for lack of a better word and, sometimes, of a proper thinking about the concept and goal.

One million news project
(and counting)
That's the number of news processed by our algos to compute the News Inflation Pressure Indices (NIPIs) and News Volume Indices (NVIs). Check this post to know how the data is compiled and aggregated.
The News Inflation Pressure Indices are here
We open up our data.

News Inflation Pressure Index to nowcast US inflation
Our news-based indicator does track US inflation which has two interesting implications 1) the information content in our NewsBot is good and 2) we can build a whole new category of indicators aimed at nowcasting economic variables using news.

The NewsBots models
Our approach to using language models in macro: supervised learning and specialised models.

Food prices at the start of COVID-19 wave 2
High frequency analytics to track food prices.

Technical Note Series: inflation classification model
We show how Natural Language Processing (NLP) can deal with rather complex tasks when given the right inputs.

Let the robot read the news for you
Machine learning can considerably enhance information gathering, within pretty much any investment process.

Tracking inflation news
The most important step in any Machine Learning project is to define the use case. In macro finance, inflation ticks all the boxes.
